What Do We Know?
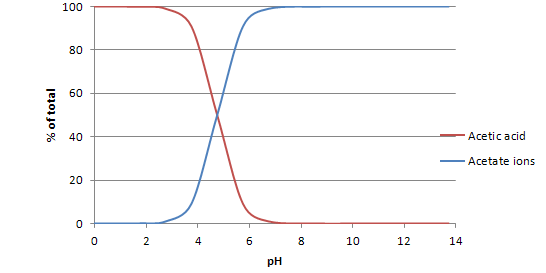
As mentioned previously, calculations of the ratio between an acid and its conjugate base are used to create speciation plots for the conjugate acid-base pair. Speciation plots graph the pH of the acid-base mixture against the percentage of the total species in solution that exist in the form of the acid or its conjugate base. Below is the speciation plot for acetic acid and acetate ions, plotted using the equation that describes weak acid-base equilibria. As the pH of the system changes, a greater percentage of acetate species exists in the form of acetate ions, rather than acetic acid.